This article uses N27 sample files mentioned by the
previous vignettes. If you are using this example, please execute the
following R code to set up. Alternatively, you can substitute variables
subject_code and subject_path accordingly.
library(threeBrain)
subject_code <- "N27"
subject_path <- "~/Downloads/N27"
brain <- freesurfer_brain2(subject_path, subject_code)
Add Electrodes
To add electrodes to the brain object, you need a electrode table
with least 5 columns: Subject, Coord_x,
Coord_y, Coord_z, Label. The
column names are case-sensitive.
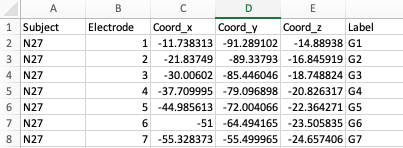
Electrode table - example
If you have performed electrode localization (see the previous
article) and exported the electrode table, the exported table can be
used here once Electrode is filled out.
For demonstration purposes, this electrode
table will be used. Please download this file and place it at
~/Downloads/N27/electrodes.csv
electrode_table <- `~/Downloads/N27/electrodes.csv`
brain$set_electrodes(electrode_table)
brain$plot()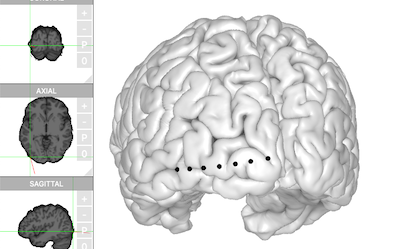
Click on one of the electrodes, the information (label, ‘MNI’ coordinates) will be displayed at top.
Add Electrode Values
In iEEG study, various of analyses can be performed on the electrodes. The analysis results are different, including
- functional data such as mean-response over time
- continuous data like p-values, z-scores
- categorical data such as cluster labels
threeBrain can visualize them all with two lines and one
data table.
First, let’s take a look To start, generate a table as follows:
| Project | Subject | Electrode | Time | sine_wave | p_value | z_score | cluster |
|---|---|---|---|---|---|---|---|
| demo | N27 | 1 | 0.00 | 0.20 | 0.05 | 1.96 | A |
| demo | N27 | 1 | 0.50 | 0.88 | 0.05 | 1.96 | A |
| demo | N27 | 1 | 1.00 | 0.98 | 0.05 | 1.96 | A |
| demo | N27 | 2 | 0.00 | 0.38 | 0.01 | 2.58 | A |
| demo | N27 | 2 | 0.44 | 0.89 | 0.01 | 2.58 | A |
| demo | N27 | 2 | 0.89 | 0.98 | 0.01 | 2.58 | A |
| demo | N27 | 3 | 0.00 | 0.56 | 0.28 | 1.09 | A |
| demo | N27 | 3 | 0.11 | 0.69 | 0.28 | 1.09 | A |
| … |
The column names are case-sensitive, and should only contain letters,
digits and _.
-
Project: (optional) the project name that this experiment belongs to -
Subject: (mandatory) the subject code; must be consistent with the brain subject code -
Electrode: (mandatory) integers of electrode channel number; correspond to theElectrodecolumn in the electrode table -
Time(optional) numerical time in seconds - Value columns (such as
sine_wave,p_value,z_score, andcluster): values of the electrodes
Download sample value table from here
and save it to ~/Downloads/N27/values.csv
electrode_table <- `~/Downloads/N27/electrodes.csv`
value_table <- `~/Downloads/N27/values.csv`
brain$set_electrodes(electrode_table)
brain$set_electrode_values(value_table)
brain$plot()
Open Data Visualization panel, change
Display Data or use keyboard shortcut d (make
sure the mouse is hovering on the brain) to switch to desired
variables.
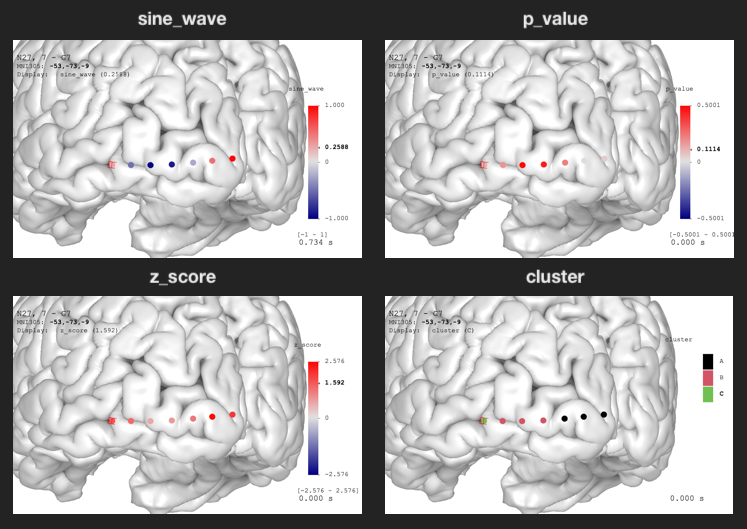
Electrode data visualization. For continuous data, the value range is automatically detected using the maximum absolute values. The color palette goes from blue to white to red with linear transition. For discrete data, the color palette uses R’s default palette.
The sine_wave is time series. You can see the animation
by toggling Play/Pause option in the
Data Visualization panel.
Change Color Palette
In the example above, the p-value legend shows the range is from
-0.5 to 0.5. This is because
threeBrain viewer’s default palette is symmetric around
zero, and the range is decided by the maximum absolute number. However,
the actual p-value should range from 0 to 1,
and we might be particularly interested in $p \leq 0.05$.
This means both the color palette and value range need to be
corrected.
In the following code, value_ranges is a named list of
such value ranges. "p_value"=c(0,1) suggests that the
p_value variable should range from 0 to 1. All other
variables adopt the default ranges. palettes is a named
list of color palettes. In this specific case, variable pal
is a vector of 64 colors. colorRampPalette is a base-R
function to interpolate colors. Please use
help("colorRampPalette") to see the documentation.
pal <- c(
  colorRampPalette(c("red", "#FFC6C6"))(8),
  colorRampPalette(c("#FFC6C6", "white"))(56)
)
brain$plot(
  value_ranges = list( "p_value" = c(0, 1) ),
  palettes = list( "p_value" = pal )
)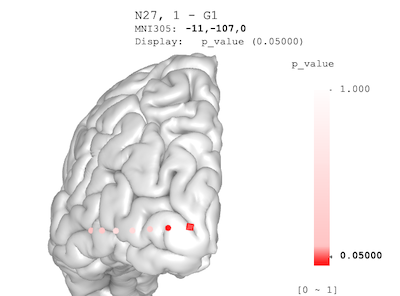
Adjusted p-value palette: the value range is from 0 to 1; the color transition is non-linear, with \(p<0.05\) rendered as deep red, and large p-values rendered as light reds
Map Electrode Values to the Surface
threeBrain provides value mapping that allows electrode
values to be displayed on the surfaces. To enable this feature, open
Surface Settings panel, and click on
Surface Color, switch to sync from electrodes,
or simply use keyboard shortcut k (make sure the mouse is
hovering over the brain) to change.
You can also hide the electrodes by switching the electrode
Visibility to hidden in the
Electrodes panel to only show the mapped results.
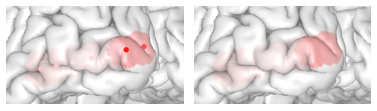
Electrode values (p-value) mapped on to the pial surface. Left: electrodes are visible; Right: electrodes are hidden.