Read and write surface files
Source:R/aaa-generics-surface.R, R/freesurfer.R, R/gifti.R
imaging-surface.RdSupports surface geometry, annotation, measurement, and
time-series data.
Please use the high-level function read_surface, which calls
other low-level functions internally.
Usage
read_surface(file, format = "auto", type = NULL, ...)

write_surface(
  x,
  con,
  format = c("gifti", "freesurfer"),
  type = c("geometry", "annotations", "measurements", "color", "time_series"),
  ...,
  name = 1
)

io_read_fs(
  file,
  type = c("geometry", "annotations", "measurements"),
  format = "auto",
  name = basename(file),
  ...
)

io_read_gii(file)

io_write_gii(x, con, ...)
Arguments
- file, con
path the file
- format
format of the file, for
write_surface, this is either'gifti'or'freesurfer'; forread_surface, see 'Arguments' section inread.fs.surface(when file type is'geometry') andread.fs.curv(when file type is'measurements')- type
type of the data; ignored if the file format is 'GIfTI'. For 'FreeSurfer' files, supported types are
'geometry'contains positions of mesh vertex nodes and face indices;
'annotations'annotation file (usually with file extension
'annot') containing a color look-up table and an array of color keys. These files are used to display discrete values on the surface such as brain atlas;'measurements'measurement file such as
'sulc'and'curv'files, containing numerical values (often with continuous domain) for each vertex node
- ...
for
read_surface, the arguments will be passed toio_read_fsif the file is a 'FreeSurfer' file.- x
surface (geometry, annotation, measurement) data
- name
name of the data; for
io_read_fs, this argument must be a character, and default is the file name; forwrite_surface, this argument can be an integer or a character, representing the index or name of the corresponding measurement or annotation column.
Examples
library(ieegio)
# geometry
geom_file <- "gifti/GzipBase64/sujet01_Lwhite.surf.gii"
# measurements
shape_file <- "gifti/GzipBase64/sujet01_Lwhite.shape.gii"
# time series
ts_file <- "gifti/GzipBase64/fmri_sujet01_Lwhite_projection.time.gii"
if(ieegio_sample_data(geom_file, test = TRUE)) {
geometry <- read_surface(ieegio_sample_data(geom_file))
print(geometry)
measurement <- read_surface(ieegio_sample_data(shape_file))
print(measurement)
time_series <- read_surface(ieegio_sample_data(ts_file))
print(time_series)
# merge measurement & time_series into geometry
merged <- merge(geometry, measurement, time_series)
print(merged)
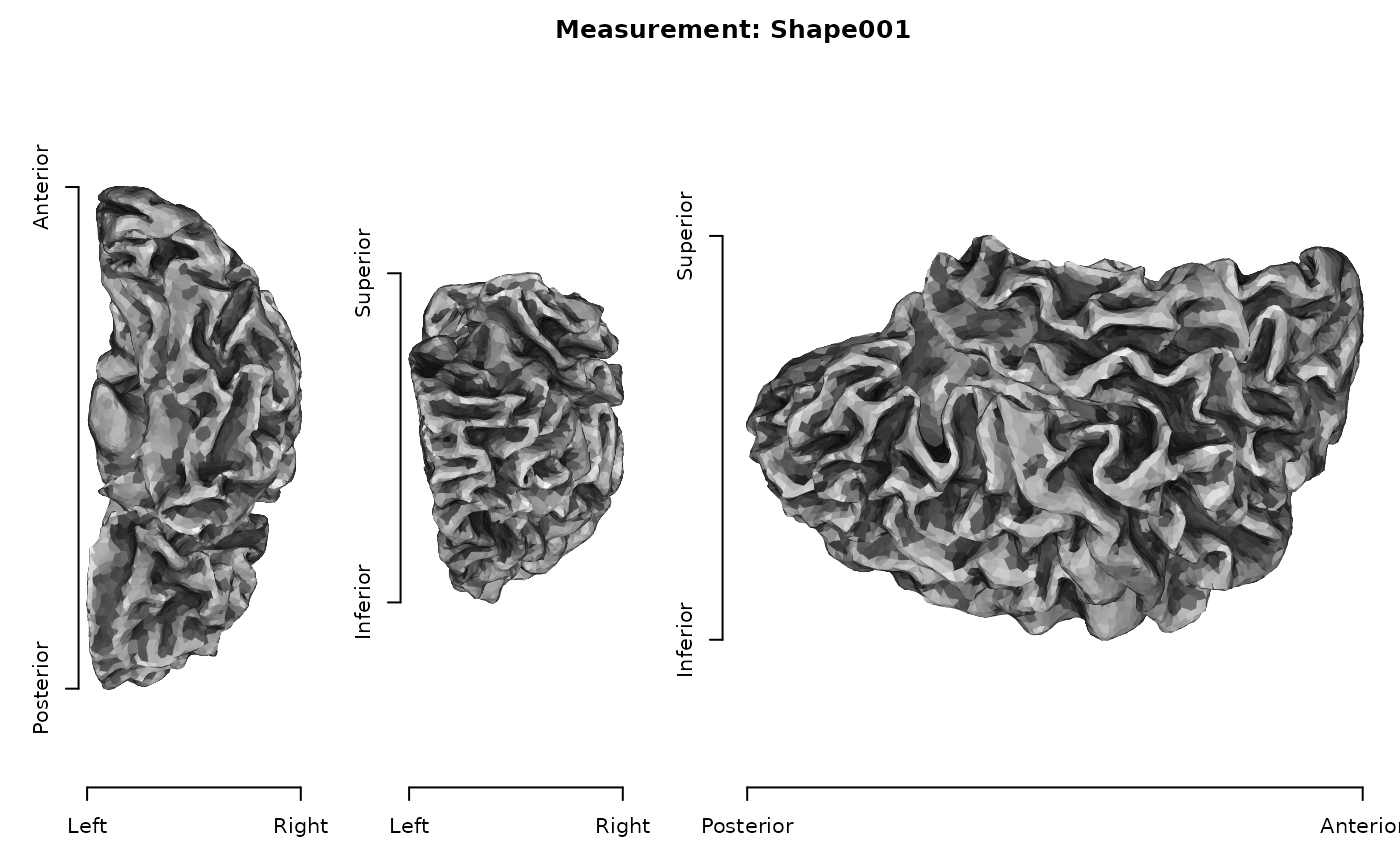
# make sure you install `rgl` package
plot(merged, name = c("measurements", "Shape001"))
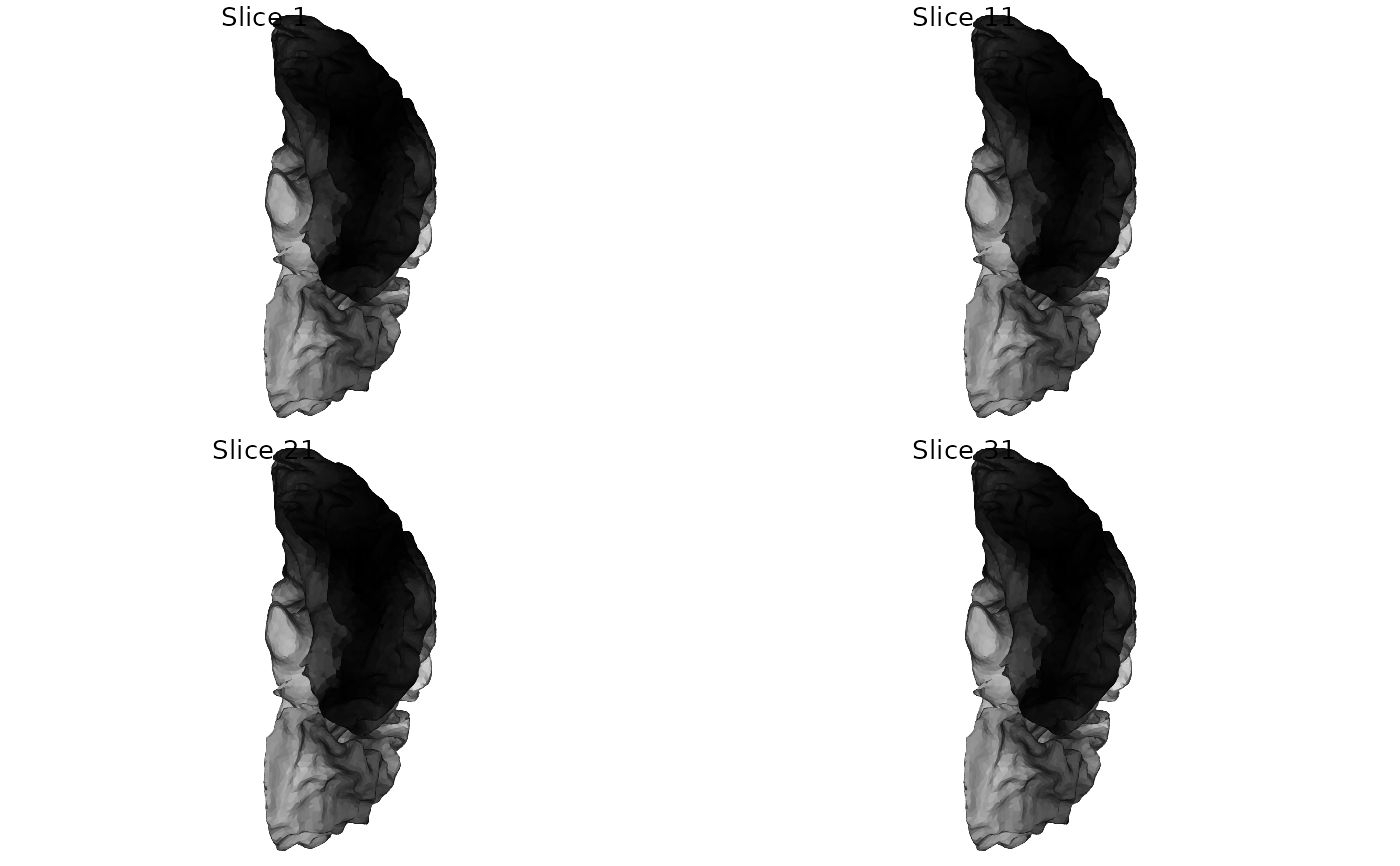
plot(merged, name = "time_series",
slice_index = c(1, 11, 21, 31))
}
#> <ieegio Surface>
#> Header class: gifti
#> Geometry :
#> # of Vertex : 22134
#> # of Face index : 44264
#> # of transforms : 1
#> Transform Targets : Unknown
#>
#> Contains: `geometry`
#>
#> <ieegio Surface>
#> Header class: gifti
#> Measurements: `Shape001`
#>
#> Contains: `measurements`
#>
#> <ieegio Surface>
#> Header class: gifti
#> Time series:
#> # of time points: 128
#> Average slice duration: NA
#>
#> Contains: `time_series`
#>
#> Merging geometry attributes, assuming all the surface objects have the same number of vertices.
#> <ieegio Surface>
#> Header class: basic_geometry
#> Geometry :
#> # of Vertex : 22134
#> # of Face index : 44264
#> # of transforms : 1
#> Transform Targets : Unknown
#> Measurements: `Shape001`
#> Time series:
#> # of time points: 128
#> Average slice duration: NA
#>
#> Contains: `geometry`, `measurements`, `time_series`
#>