Find peaks of a signal
Examples
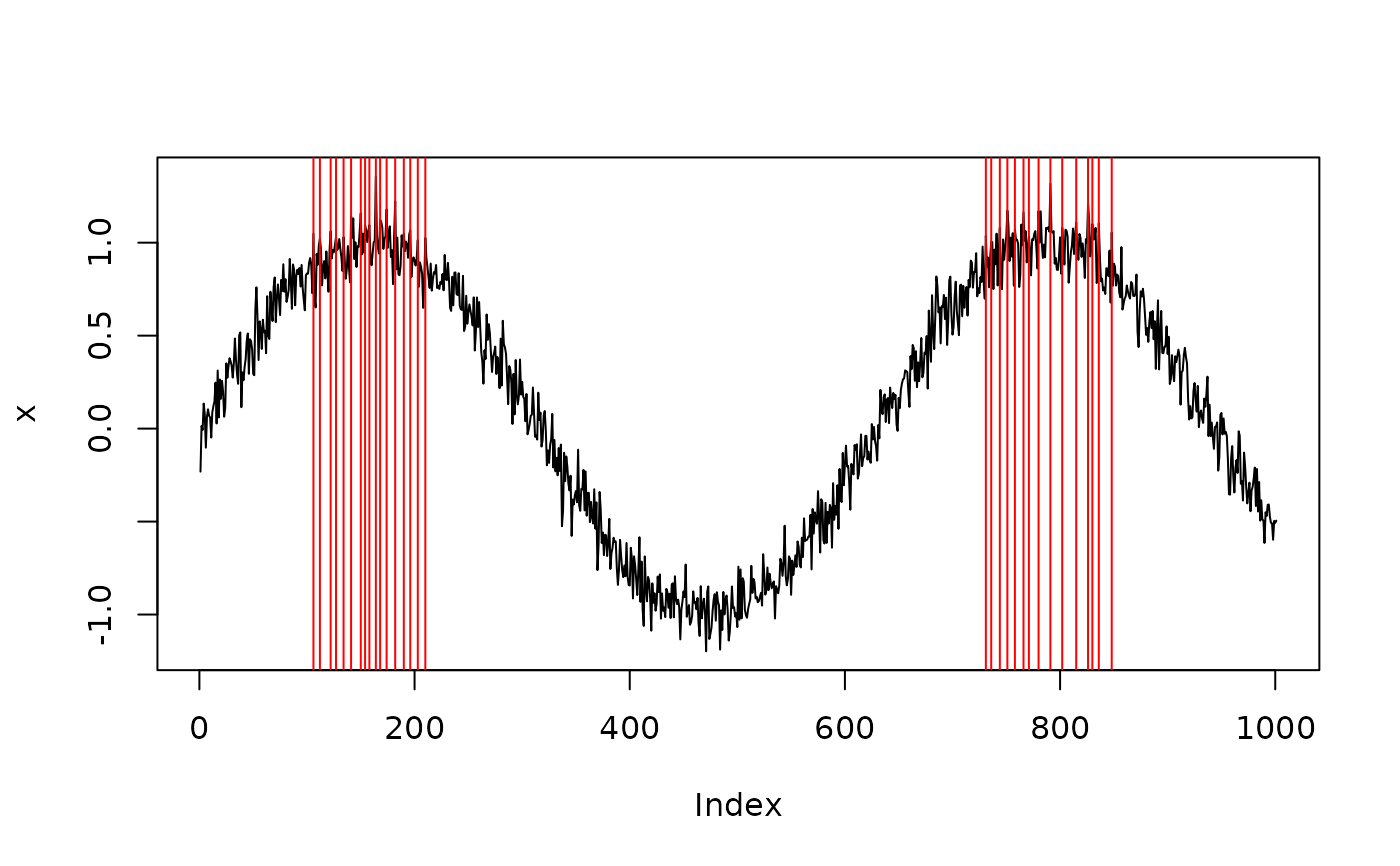
# Basic example
x <- sin(seq(0, 10, 0.01)) + rnorm(1001) * 0.1
peaks <- find_peaks(x)
plot(x, type = 'l')
abline(v = peaks$index, col = 'red')
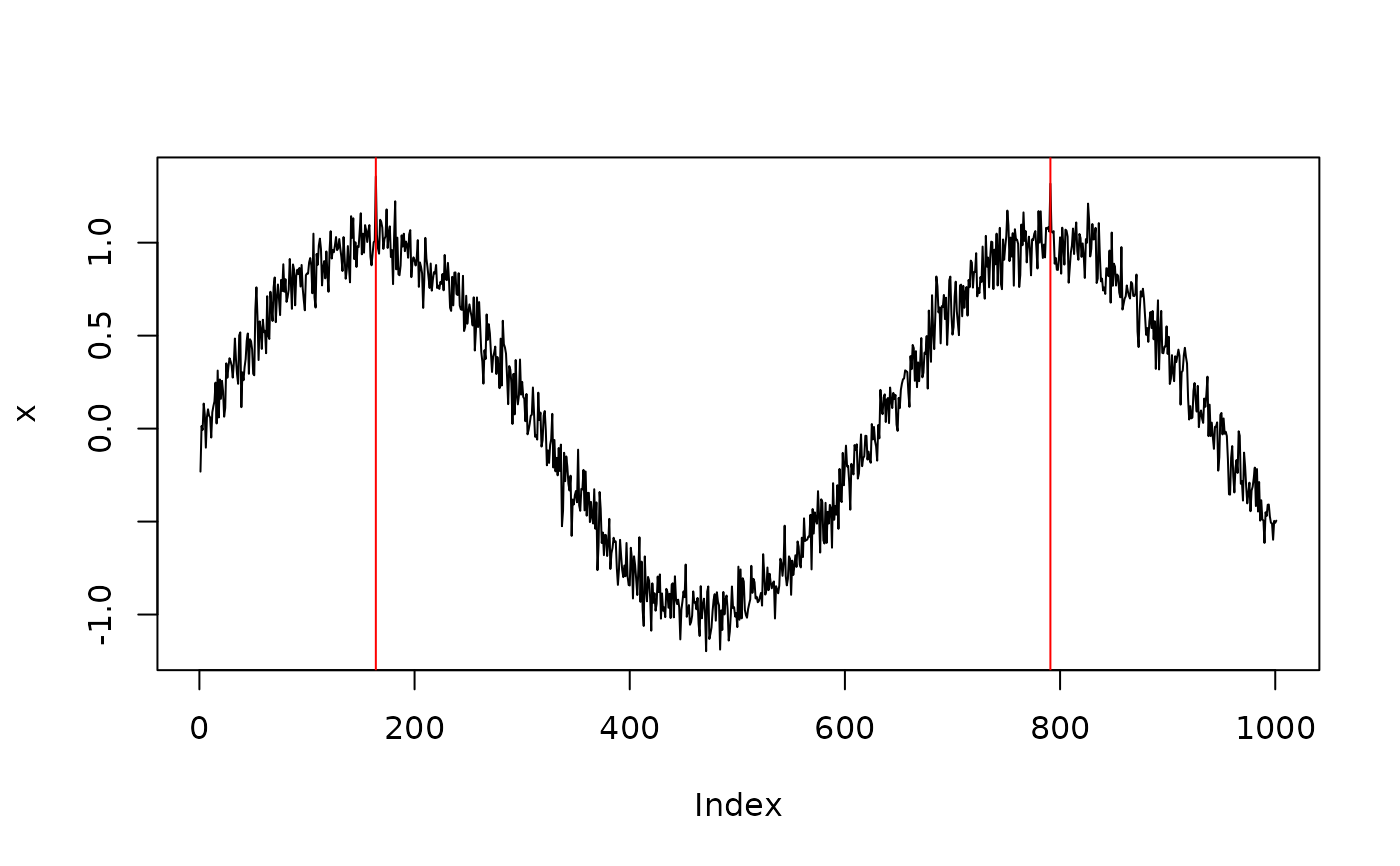
 # merge peaks that are close
peaks <- find_peaks(x, min_distance = 400)
plot(x, type = 'l')
abline(v = peaks$index, col = 'red')
# merge peaks that are close
peaks <- find_peaks(x, min_distance = 400)
plot(x, type = 'l')
abline(v = peaks$index, col = 'red')
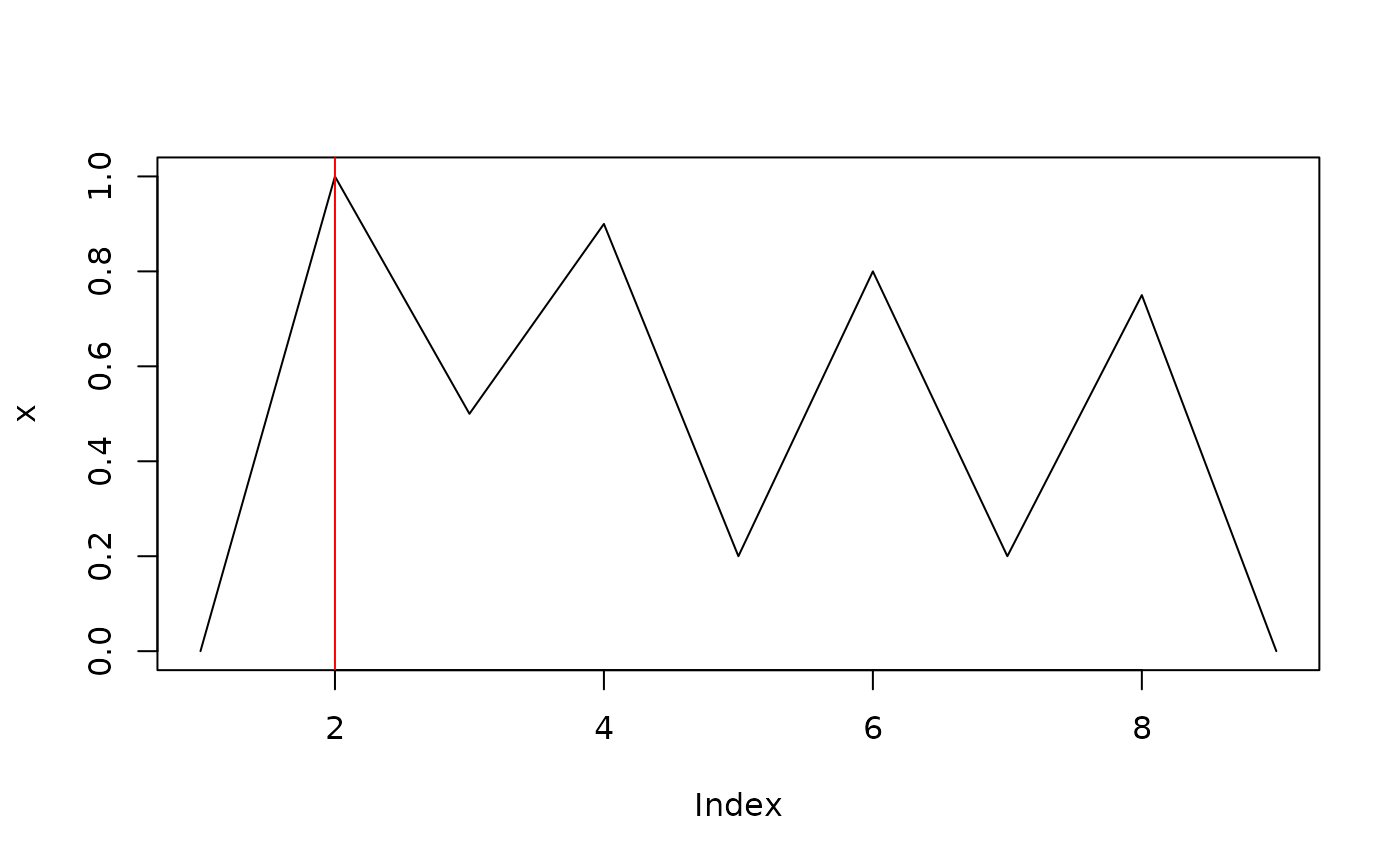
 # with or without min_width
x <- c(0, 1, 0.5, 0.9, 0.2, 0.8, 0.2, 0.75, 0)
# without min_width
peaks <- find_peaks(x, min_width = 0)
plot(x, type = 'l')
abline(v = peaks$index, col = 'red')
# with or without min_width
x <- c(0, 1, 0.5, 0.9, 0.2, 0.8, 0.2, 0.75, 0)
# without min_width
peaks <- find_peaks(x, min_width = 0)
plot(x, type = 'l')
abline(v = peaks$index, col = 'red')
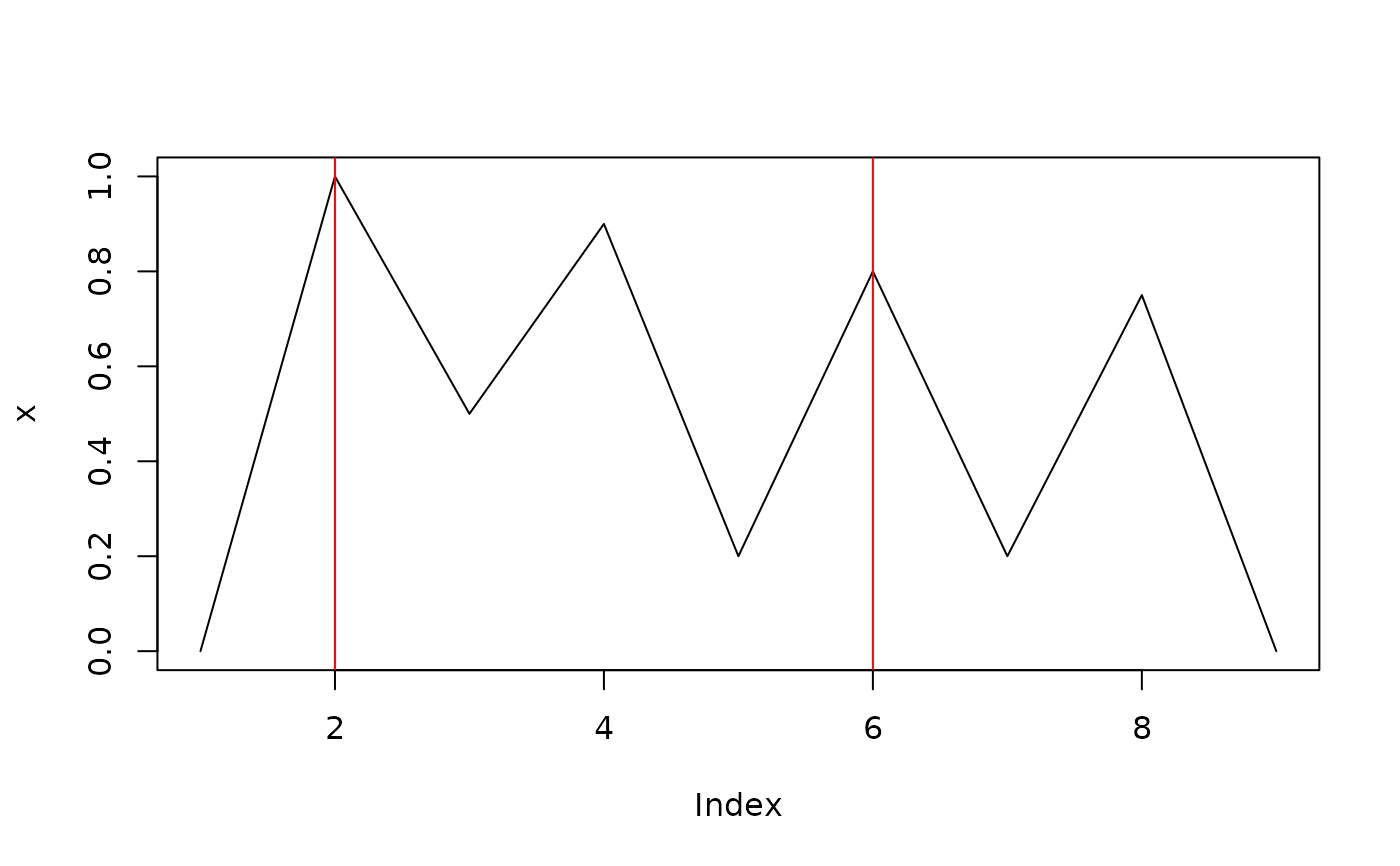 # with min_width=2: t=4 is greater than t=6
peaks <- find_peaks(x, min_width = 2)
plot(x, type = 'l')
abline(v = peaks$index, col = 'red')
# with min_width=2: t=4 is greater than t=6
peaks <- find_peaks(x, min_width = 2)
plot(x, type = 'l')
abline(v = peaks$index, col = 'red')