Linearly maps a numeric vector onto a color ramp, clamping values outside the given range to the range's endpoints.
Usage
color_ramp_continuous(
  values,
  clim = range(values, na.rm = TRUE),
  cmap = grDevices::hcl.colors(11),
  ...
)
Arguments
- values
numeric vector of values to map to colors
- clim
length-two numeric vector giving the value range to map from; values outside
[clim[1], clim[2]]are clamped to the nearer endpoint before mapping. Default isrange(values, na.rm = TRUE)- cmap
the color ramp to map onto: either a vector of colors (passed to
colorRampto build the ramp function) or a function such as the one returned bycolorRampthat takes a numeric vector with elements in[0, 1]and returns ann x 3(orn x 4, with alpha) matrix of color-channel values in[0, 255]. Default isgrDevices::hcl.colors(11)- ...
passed to
colorRampwhencmapis a vector of colors (for example,alpha = TRUEto build an alpha-aware ramp)
Examples
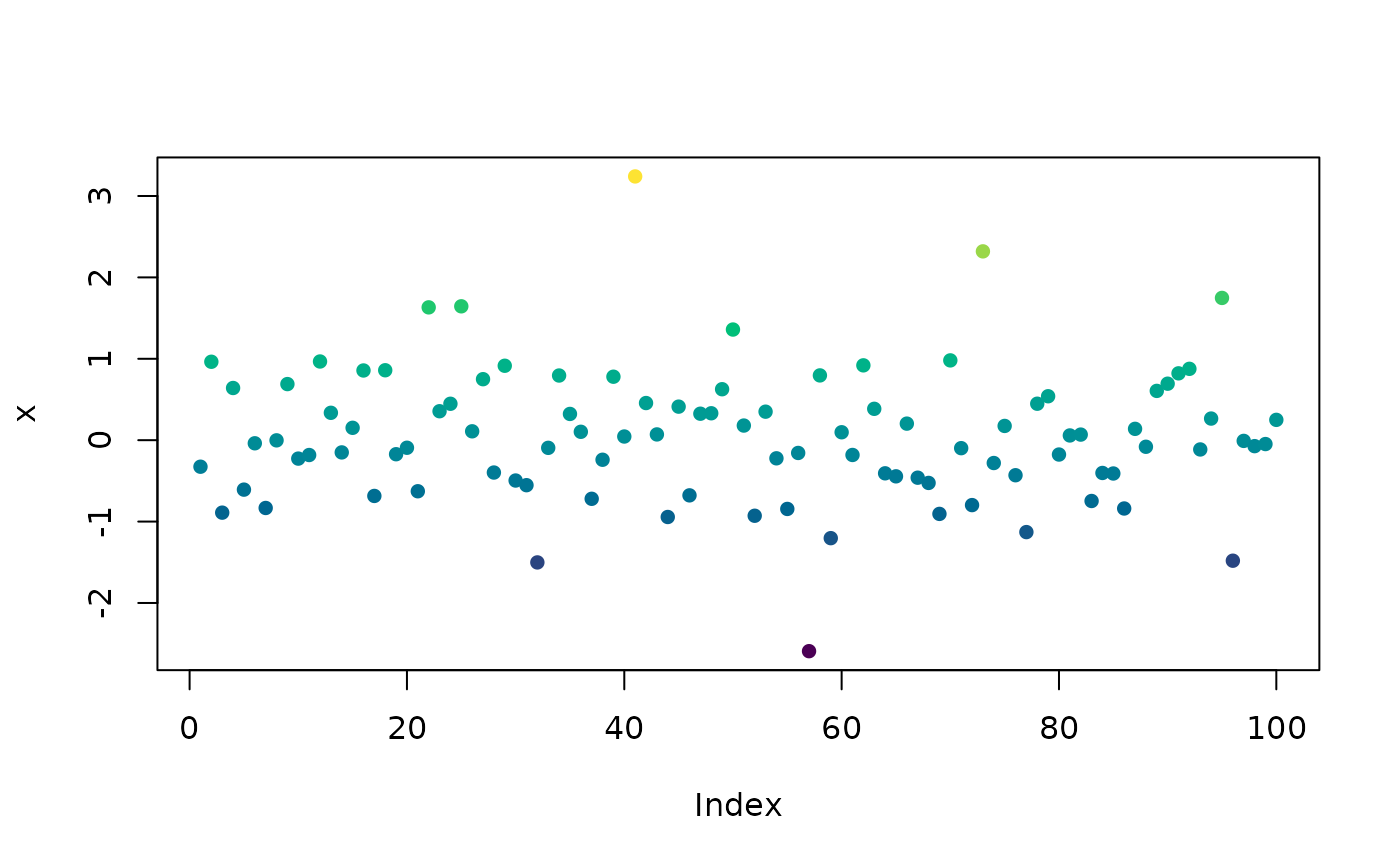
x <- rnorm(100)
col <- color_ramp_continuous(x)
plot(x, col = col, pch = 16)
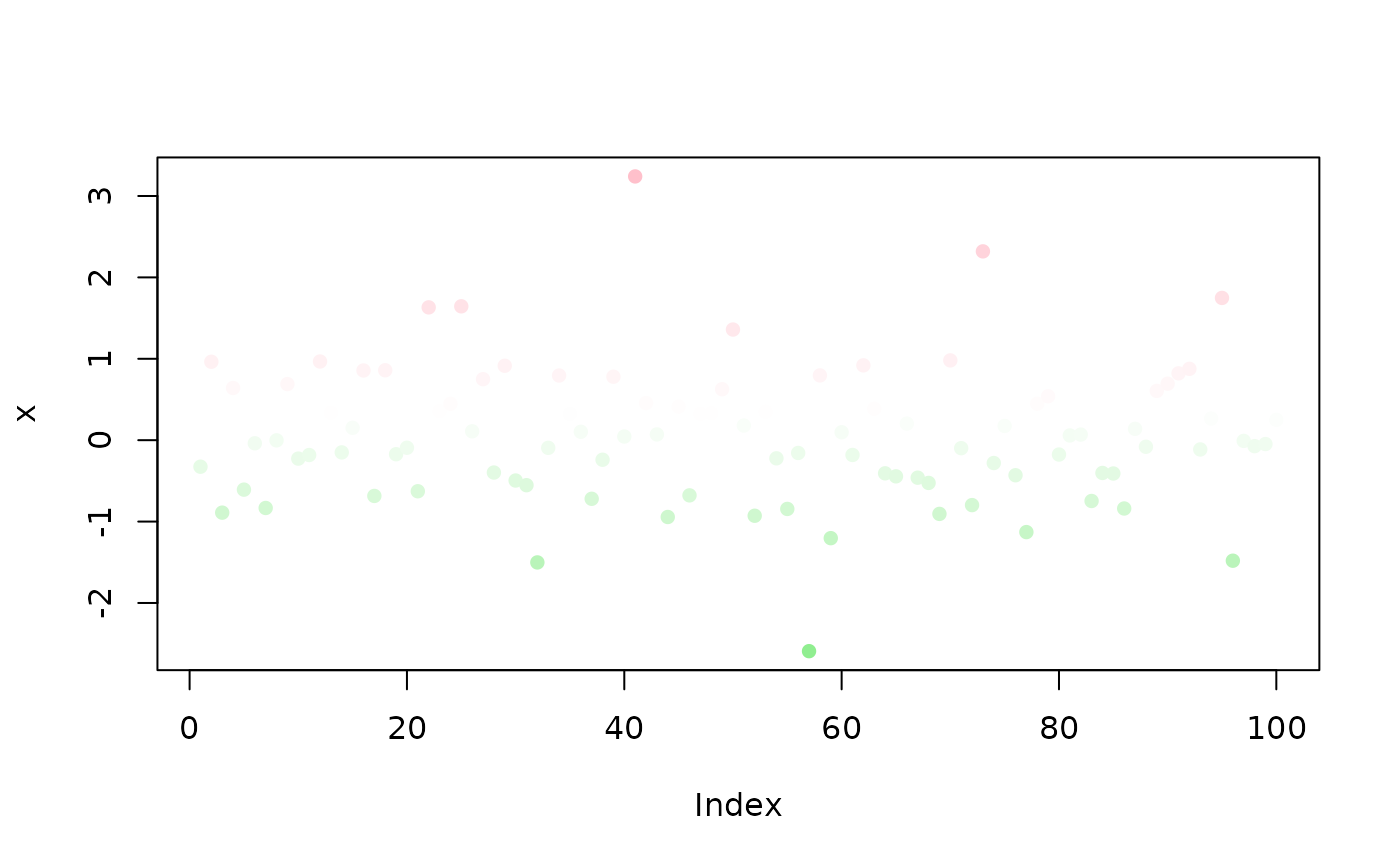
 # Change color palettes with vector of colors
col <- color_ramp_continuous(
x, cmap = c("lightgreen", "white", "pink"))
plot(x, col = col, pch = 16)
# Change color palettes with vector of colors
col <- color_ramp_continuous(
x, cmap = c("lightgreen", "white", "pink"))
plot(x, col = col, pch = 16)
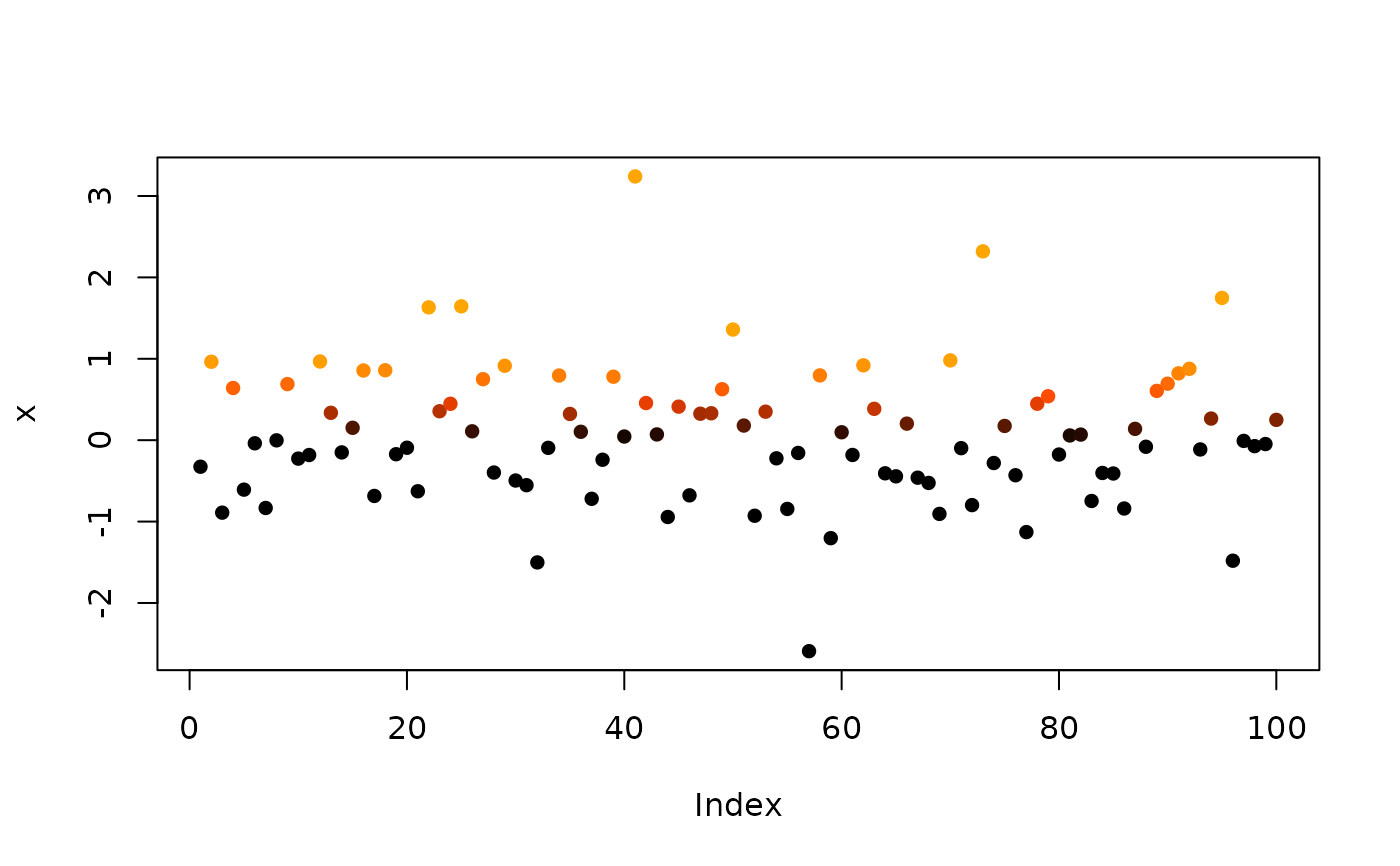
 # Using colorRamp
col <- color_ramp_continuous(
x, cmap = colorRamp(c("black", "orangered", "orange")))
plot(x, col = col, pch = 16)
# Using colorRamp
col <- color_ramp_continuous(
x, cmap = colorRamp(c("black", "orangered", "orange")))
plot(x, col = col, pch = 16)
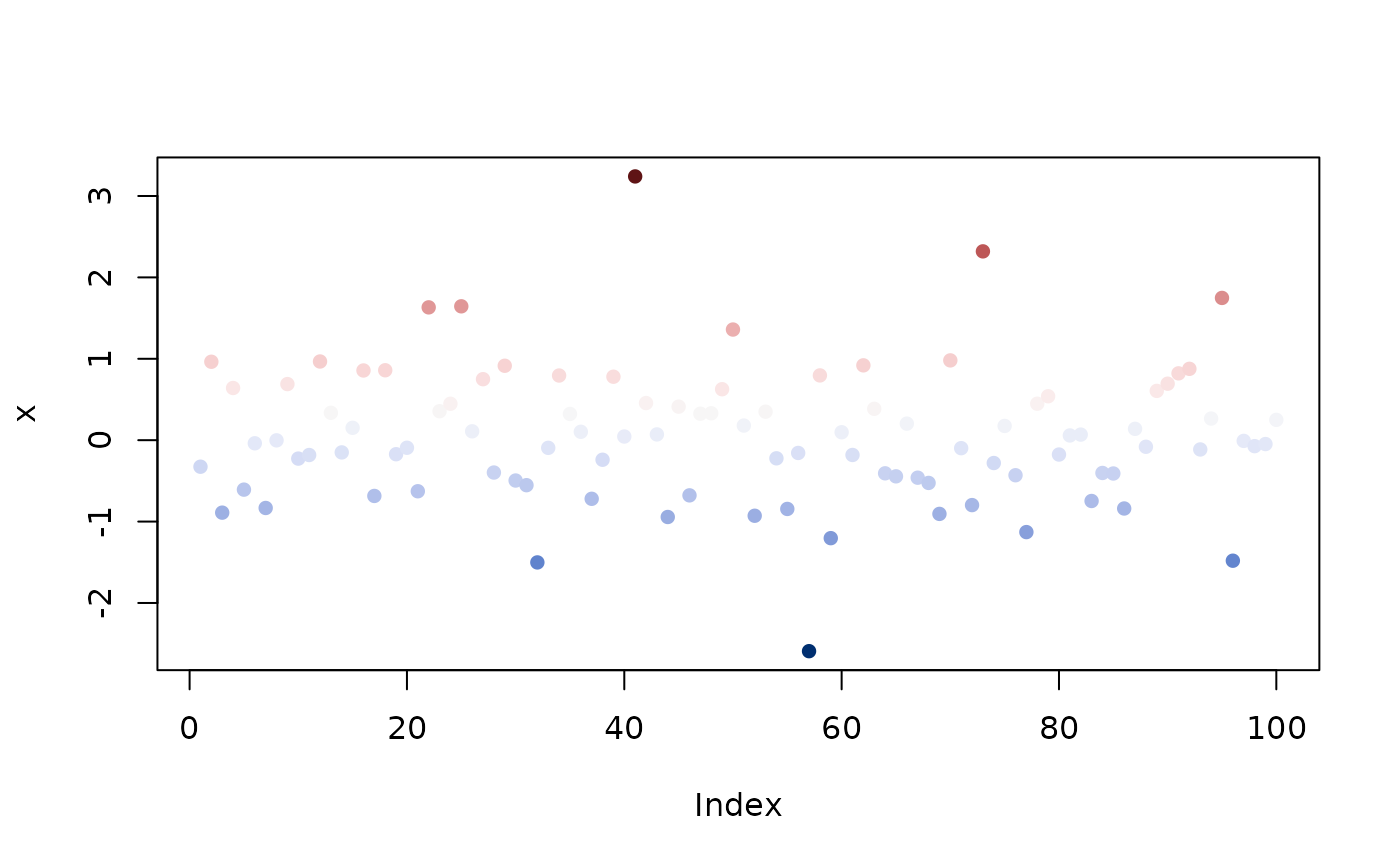
 # Using color ramp palette `function(n) { ... }`
col <- color_ramp_continuous(
x, cmap = hcl.colors, palette = "Blue-Red 3")
plot(x, col = col, pch = 16)
# Using color ramp palette `function(n) { ... }`
col <- color_ramp_continuous(
x, cmap = hcl.colors, palette = "Blue-Red 3")
plot(x, col = col, pch = 16)
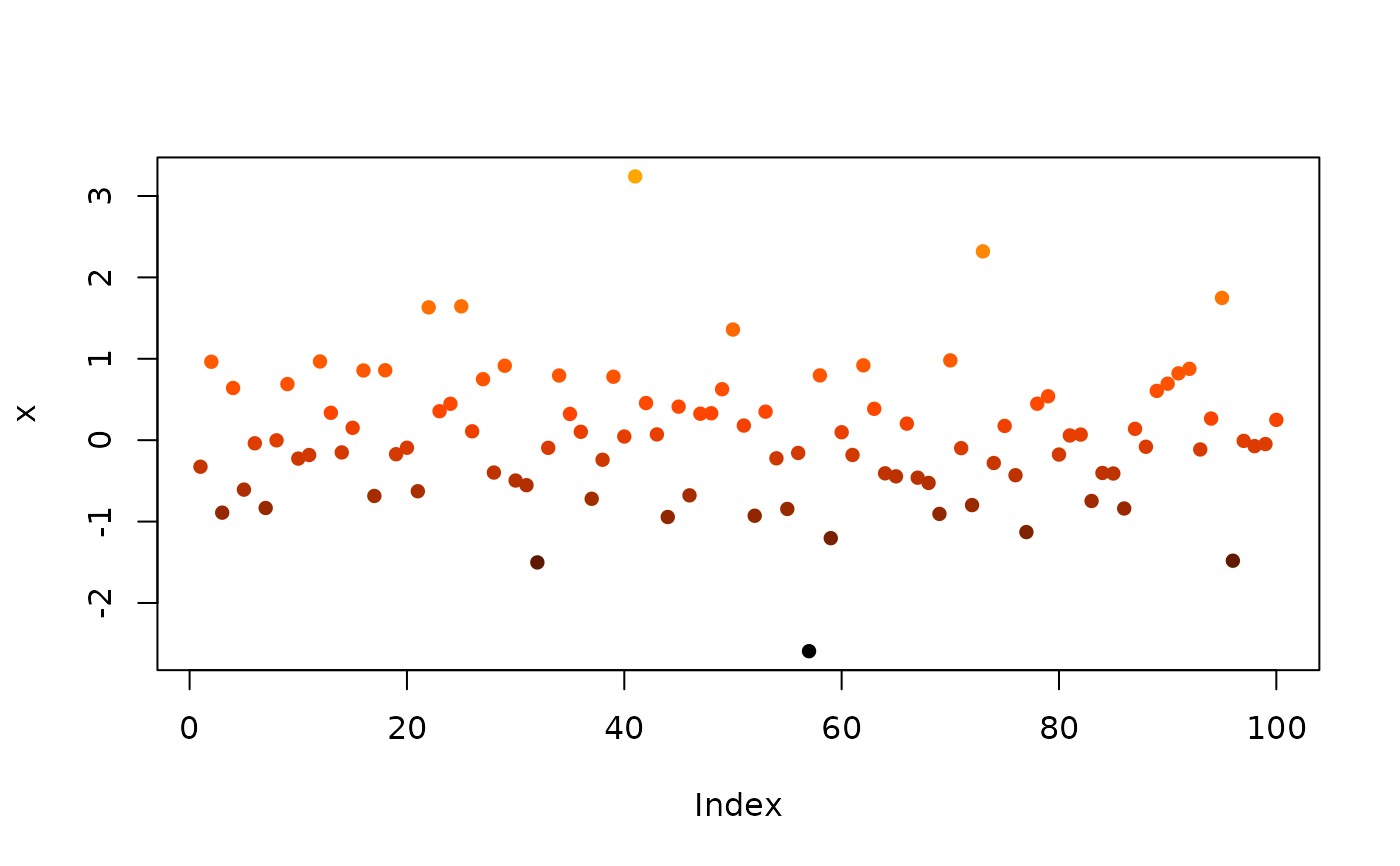
 # Set range
col <- color_ramp_continuous(
x, clim = c(0, 1),
cmap = c("black", "orangered", "orange"))
plot(x, col = col, pch = 16)
# Set range
col <- color_ramp_continuous(
x, clim = c(0, 1),
cmap = c("black", "orangered", "orange"))
plot(x, col = col, pch = 16)