Plot '3D' volume in anatomical slices
Usage
# S3 method for class 'ieegio_volume'
plot(
  x,
  position = c(0, 0, 0),
  center_position = FALSE,
  which = c("coronal", "axial", "sagittal"),
  slice_index = 1L,
  transform = "vox2ras",
  zoom = 1,
  pixel_width = max(zoom/2, 1),
  col = c("black", "white"),
  alpha = NA,
  crosshair_gap = 4,
  crosshair_lty = 2,
  crosshair_col = "#00FF00A0",
  label_col = crosshair_col,
  continuous = TRUE,
  vlim = NULL,
  add = FALSE,
  main = "",
  axes = FALSE,
  background = col[[1]],
  foreground = col[[length(col)]],
  ...,
  .xdata = x$data
)
Arguments
- x
'ieegio_volume'object; seeread_volume- position
position in
'RAS'(right-anterior-superior) coordinate system on which cross-hair should focus- center_position
whether to center canvas at
position, default isFALSE- which
which slice to plot; choices are
"coronal","axial", and"sagittal"- slice_index
length of 1: if
xhas fourth dimension (e.g. 'fMRI'), then which slice index to draw- transform
which transform to apply, can be a 4-by-4 matrix, an integer or name indicating the matrix in
x$transforms; this needs to be the transform matrix from voxel index to 'RAS' (right-anterior-superior coordinate system), often called'xform','sform','qform'in 'NIfTI' terms, or'Norig'in 'FreeSurfer'- zoom
zoom-in level
- pixel_width
pixel size, ranging from
0.05to50; default is the half ofzoomor1, whichever is greater; the unit ofpixel_widthdivided byzoomis milliliter- col
color palette for continuous
xvalues- alpha
opacity value if the image is to be displayed with transparency
- crosshair_gap
the cross-hair gap in milliliter
- crosshair_lty
the cross-hair line type
- crosshair_col
the cross-hair color; set to
NAto hide- label_col
the color of anatomical axis labels (i.e.
"R"for right,"A"for anterior, and"S"for superior); default is the same ascrosshair_col- continuous
reserved
- vlim
the range limit of the data; default is computed from range of
x$data; data values exceeding the range will be trimmed- add
whether to add the plot to existing underlay; default is
FALSE- main, ...
passed to
image- axes
whether to draw axes; default is
FALSE- background, foreground
background and foreground colors; default is the first and last elements of
col- .xdata
default is
x$data, used to speed up the calculation when multiple different angles are to be plotted
Examples
library(ieegio)
nifti_file <- "nifti/rnifti_example.nii.gz"
nifti_rgbfile <- "nifti/rnifti_example_rgb.nii.gz"
# Use
# `ieegio_sample_data(nifti_file)`
# and
# `ieegio_sample_data(nifti_rgbfile)`
# to download sample data
if(
ieegio_sample_data(nifti_file, test = TRUE) &&
ieegio_sample_data(nifti_rgbfile, test = TRUE)
) {
# ---- NIfTI examples ---------------------------------------------
underlay_path <- ieegio_sample_data(nifti_file)
overlay_path <- ieegio_sample_data(nifti_rgbfile)
# basic read
underlay <- read_volume(underlay_path)
overlay <- read_volume(overlay_path)
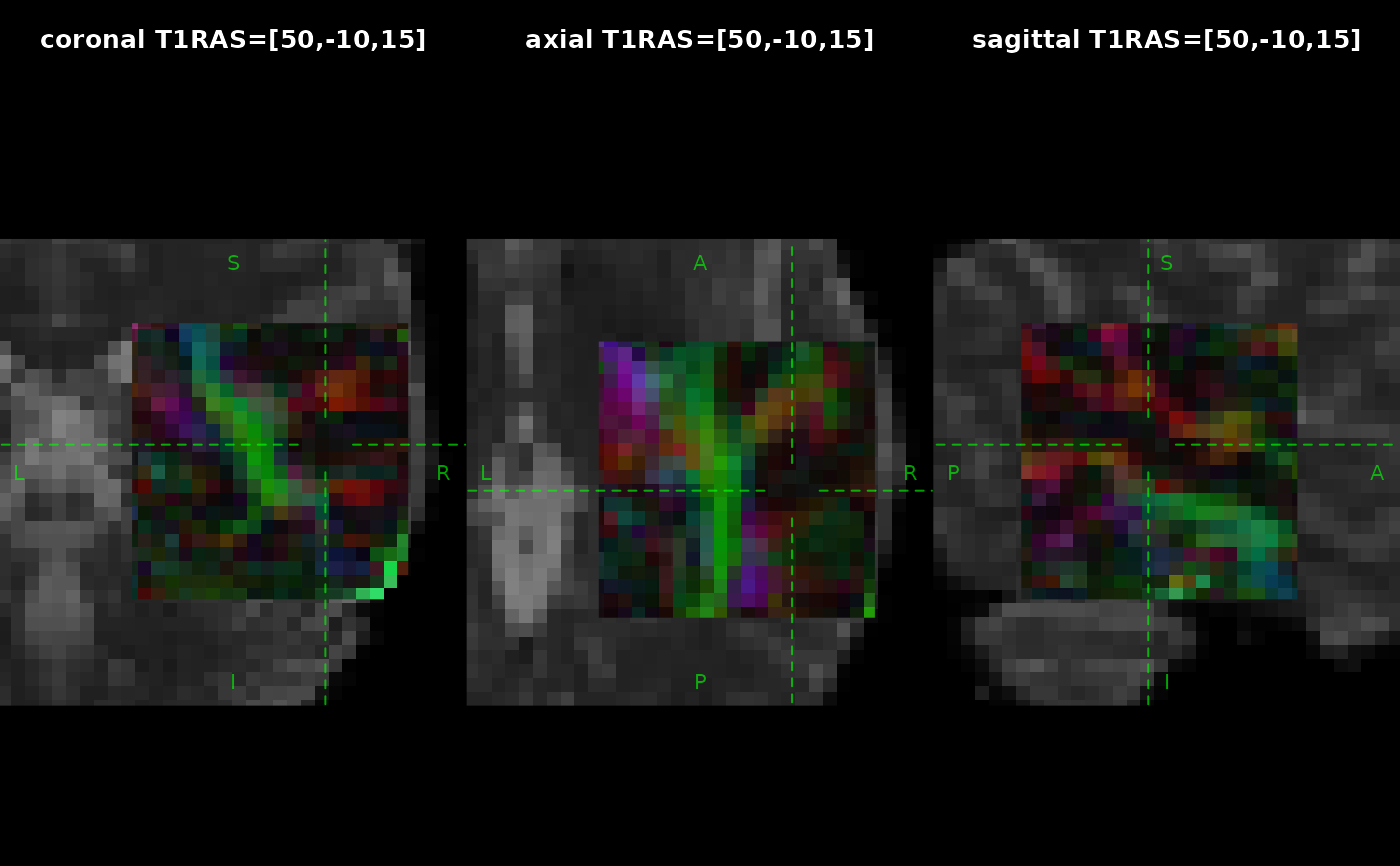
par(mfrow = c(1, 3), mar = c(0, 0, 3.1, 0))
ras_position <- c(50, -10, 15)
ras_str <- paste(sprintf("%.0f", ras_position), collapse = ",")
for(which in c("coronal", "axial", "sagittal")) {
plot(x = underlay, position = ras_position, crosshair_gap = 10,
crosshair_lty = 2, zoom = 3, which = which,
main = sprintf("%s T1RAS=[%s]", which, ras_str))
plot(x = overlay, position = ras_position,
crosshair_gap = 10, label_col = NA,
add = TRUE, alpha = 0.9, zoom = 5, which = which)
}
}